Tag Archives: tools


Deprecated: Function get_magic_quotes_gpc() is deprecated in /home2/flyfouch/public_html/wp-includes/formatting.php on line 4387

CDC Launches Re-Design, Focus on Tools

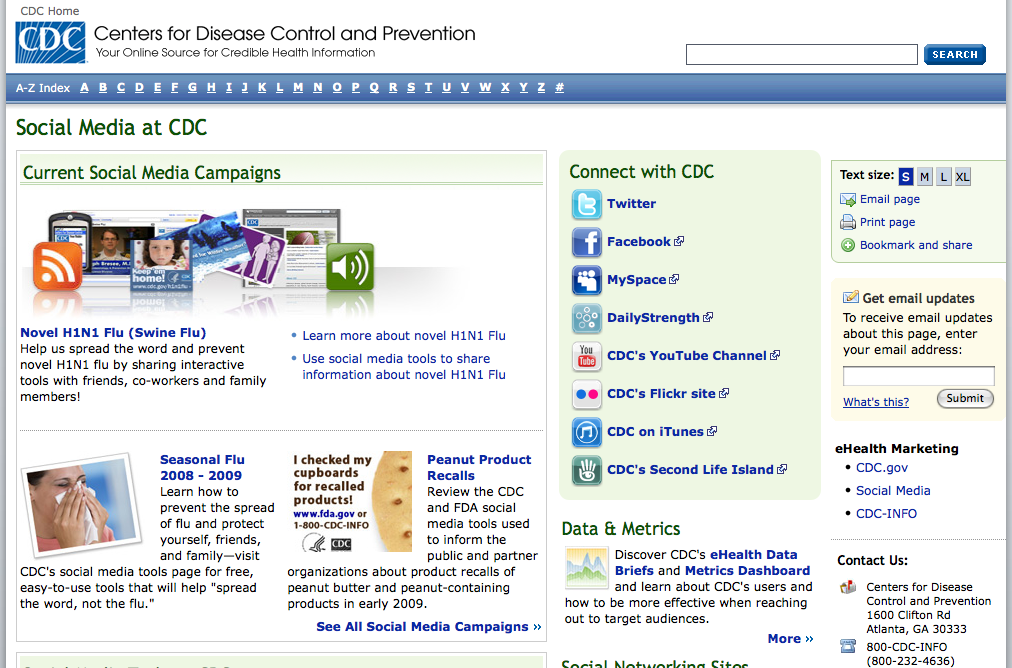
Today, I received a tip that Monday night, CDC.gov launched it’s re-designed Web site–placing a larger emphasis on tools. I think it’s looking pretty good myself–especially the “connect” icons as I’m a large fan of communicating visually. Plus, icons are fun, right? What about you? What are your thoughts?

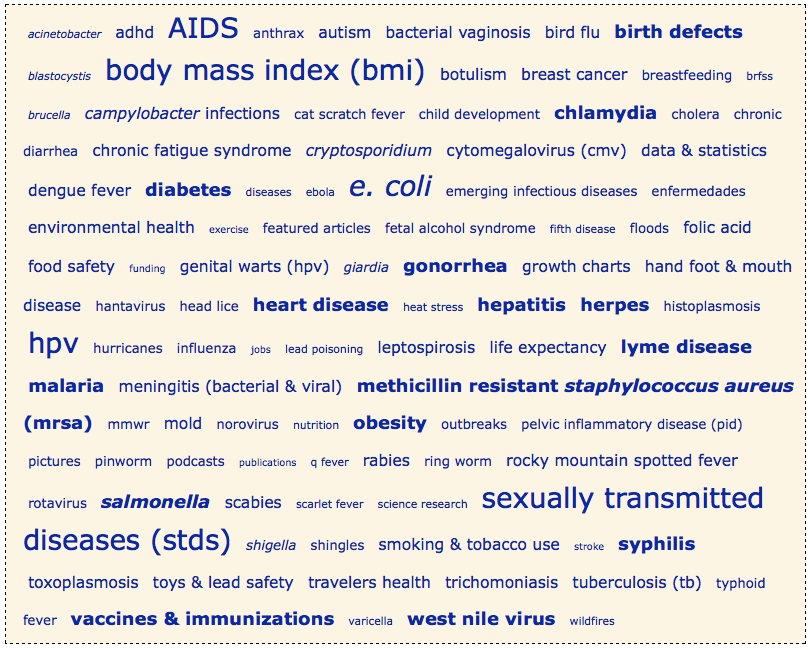
I think one of my all-time favorite features is the CDC.gov Tag Cloud. According to the Web site, “[the] Tag Cloud is an alphabetized list of the most popular search topics on the CDC.gov Web site. The text size of the term shows its relative popularity: bigger terms are more popular than smaller ones.” Even better, each term is click-able for information about that specific topic. Here’s a quick snap shot:

It’s simple. It’s user-generated (via consumer search queries). It offers a quick snapshot to what consumers are concerned about in regards to public health. And, thus, it’s powerful. And, it communicates all this and more, visually. For a visual learner like myself, I give it two thumbs up. I’m envisioning that one day, we might be able to update these types of queries in real-time, though from my own experience, I also know it’s going to be a challenge.

What Creates a Revolution?

“A revolution doesn’t happen when a society adopts new tools, it happens when a society adopts new behaviors.”

–Us Now Movie Trailer Preview

Today, I was skimming through my RSS feeds and one of my favorites had an update: Mike Kujawski’s Public Sector 2.0 blog. Mike gets social marketing (the real kind), and he is also a savvy social media professional. On his site, he posted the Us Gov movie trailer, which I had seen before on Maxine Teller’s blog, but today, the last quote (located above) really stood out to me the most.

It stood out because in it I saw a profound statement being made on behavior change. It may be due to me coming away from my talk with a class of smart Yale students, where their *good* questions focused a lot on the why of social media (measurement, literacy, behavior change, clutter vs. content, society’s relationship to technology, etc.). But, I feel like this quote gest to the heart of the relationship between social media and social marketing, and why the relationship is important.

  1. It’s not about the tools (i.e. being cool or shiny)
  2. Change (i.e. revolution, small or big) is a result of adopting/influencing new behavior (whether it be that of a society, an organization or an individual).

Currently, at an increasing rate, society is experimenting and applying social media tools, both for the good and the bad. Thus, we as practitioners need to be aware of this and how it is affecting one’s behavior. For example, I tease that in 10 years, we will be doing public health campaigns for internet addiction…but how far away is that really? We already have them for TV addiction. Take a quick look here at the Us Now documentary preview, as it’ll provide some more juices to step back and do some introspection and reflection.  

httpv://www.youtube.com/watch?v=LlqU1o3NmSw

If you find this interesting and what to dig beyond the tools and really get to “what does this all mean?” Then, I also highly recommend visiting the Digital Ethnography blog and getting introduced to Professor Michael Wesch, who was named Professor of the Year for 2008. He and his students have some interesting and compelling videos on what “more than the tools” have to mean and why it’s important to know.

If you want to continue discussion on “what government may/can look like,” then I also recommend following both the Government 2.0 Club and the Government 2.0 Camp conversations (if you can’t physically attend the gathering coming up soon at the end of MArch) on Twitter too.

…because after all, what creates a revolution? and what does a revolution look like?

flickr photo credit: Wesley Fryer
9 Useful [& free] Web Analytic Time Killers

From searching for web analytic tools and social media that encourage evaluation tools lately, I have been able to generate a fun list of sites that you could easily kill time with….while also having fun and learning technical insights into web analytics. Enjoy, =)

1. SEO Website Grader (Thank you Dr. Stephen Dann for this amazing tool!)

This site allows you to receive a monthly report providing helpful and useful SEO information on any site of your choice, AND to compare it against competing sites. A great resource for any search engine optimization or interactive marketing plans. Warning: Hours of time will go by before you realize it! 😉

2. Is your website Hott or Not….err, ok or ko?

Ok, we’re not in high school anymore, but don’t act like you’ve never checked out the infamous Hott or Not website or uploaded your friend’s picture to the site as a joke…

Well, now you can rate websites based on the design of their homepage with a 1-10 ranking and see the average rating other websites have received. To become a repeat visitor, register your website into the bank and see what other users rate it!

3. Blogpulse

Blogpulse is a Nielsen Buzzmetrics tool that allows one to create customized graphs based on keyword trends for chosen keywords. Other tools include featured keyword graphs based on popular keywords, conversation tracker which follows trackbacks and permalinks between blogs and blogger profiles that show the most recent posts, the sources used, numbers of times the bloggers is cited by fellow bloggers and a list of 10 related blogs. This is great for monitoring how the blogosphere views your brand, topic or organization and helps identify blog networks.

4. Ice Rocket

Ice Rocket is like a smaller version of Blogpulse and allows you to make keyword trend graphs, but only for the most recent three months, while Blogpulse lets you make a graph for the last 6 months.

5. Popular Viral Video Aggregate

Like PopURLS, only for videos, this site shows the most popular videos for YouTube, Metacafe, MySpace, Yahoo, ifilm, Break.com, Grounder and Google.

6. See Google’s top sites based on non-keyword metrics

This link takes out all the keyword data in Google and shows you what sites Google sees as the best ranked with the most traffic.

7. Alltop Topic: Social Media

Alltop is a blog aggregate that provides the most recent 5 posts from the top 40 blogs, sorted by topic. Topics include social media, nonprofit, moms, life, dads, career, celebrities, games, SEO, Macintosh, Windows, Journalism, world news, photography and more!

8. PopURLs

PopURLS is an aggregate that provides the most popular links across the web including digg, del.icio.us, flickr, reddit, Truemors, YouTube, Google and Yahoo news, AOL Video, Mahalo, Twitter and more!

9. Hits Log

Hits Log is an SEO tool that allows you to discover your site’s Google Pank Rank and search engine rank. Though not as useful as Website grader, it may be easier for some to use.

    Feel free to add to the list.

Mapping Out Your Strategy: Using Maps as a Means for Marketing

Google Earth recently launched its iPhone app, so what does this mean. I think this means more non-profits and organizations taking notice on how to literally, map out their strategy.

Mapping Fun

Mapping, mainly through Google earth and Google maps, has been increasing in use. I was first introduced to mapping glorious-ness by my fiance. When we went to Rome last year, he created a Google map highlighting all the Gelato hot spots in Rome. What more can I ask for than a man who not only shares my second love of ice cream, but plans it as key stopping point while we tour Italy? Now, In terms of relevant non-profit mapping, I was moved by 1) Wild Apricot’s recent post about Google Earth outreach, and 2) a SB Reader.

As Wild Apricot shares:

Google Earth and Google Maps let anyone create a custom map — and share it by sending a link, or embed on a web page. Personalized and annotated, even enhanced with photographs and videos, online maps can help to engage your supporters in a way that bare text never can. New features now let you collaborate with others and import geographical data to customize a map.

Case Study Highlight

SocialButterfly reader, Dan, at Tutor Mentor Connections recently shared with me how he and his non-profit are utilizing mapping technolgoy. Over the past six months, Tutor Mentor Connections have developed a library of maps that are intended as tools that leaders use to support the growth of volunteer-based tutor/mentor programs in specific geographic areas in Illinois. I conducted an email interview with Dan which I will feature later this week, but here is a sneak preview:

Why mapping?

“Maps are one form of visual communications. Pictures are worth thousands of words in communicating ideas. Generals use maps to distribute troops in time of war. They do this to make sure they have forces everywhere they are needed. A city could have a telephone directory full of youth program listings, and still not have programs in half of the places where they are needed. Maps can help leaders understand where there are programs, and can be used to help build business/non profit collaborations. They can be used as tools in any leadership strategy.”

I look forward to sharing Dan’s work with you as I think Dan is doing a fantastic job of creating a 1, 2 Punch when it comes to tackling giant issues (i.e. poverty and education) through mapping technology. Crafting data, supported by research, and translating that creatively through meaningful, visual representation.

Others Examples of Non-Profits Mapping

  1. Google Earth’s outreach blog highlights 10 example case studies on how non-profits have used Google Earth for their efforts. These groups include: the U.N. Environment Programe, EDGE, The Jane Goodall Institute, U.S. Holocaust Museum, Sierra Club and others. Whether this means providing virtual tours, highlighting the location of endangered species, or elevating the work of researchers and scientists, mapping can provide innovative and creative ways to communicate a message visually.
  2. The New Orleans Food and Farm Network used Google Maps to show how residents in devastated areas where to find food, from grocery stores and restaurants, to farmers’ markets and emergency kitchens. Additional related outreach included the distribution of paper and PDF maps.
  3. Mobilizing Youth – Though an older post from August 2007, the blog lists over 25 examples of non-profits using maps to conserve rainforests to raising awareness for child cruelty.
  4. Factory Farm Map – Food & Water Watch, a nonprofit consumer organization concerned with clean water and safe food issues, had the goal to illustrate the growth of factory farms across the United States, mapping US Census data to show how and where animal production is becoming concentrated in different regions of the country. (Wild Apritcot) Thus, enter mapping technology to bridge the disconnect between dense data and understanding.

Where to Get Mapping

Tools

  • Google Earth, Google Earth Plus, Google Earth Pro
    • According to Wild Apricot’s summise, NP’s can use Google Earth Free, but it is not to be used to provide paid services. Compare Google earth packages to determine the one you need for your project. For the Pro version, organizations. To see what financial assistance may be available, be sure to check out Google Earth’s grant program.
  • Google Maps
  • CommunityWalk.com
  • MapBuilder
    • A mashup development tool that builds custom Google and Yahoo maps without any knowledge of the Google/Yahoo Maps API and JavaScript.
  • PlaniGlobe
    • Create interactive maps using a vector architecture base.
  • Zee Maps
    • Quickly create interactive world maps through a service that allows you to add your own search query, allow for user-admins and is multiple-user friendly.
  • Frappr
    • Frappr collects three pieces of information: an online guest book, a hit log and a map. Using Google Map technology, visitors to Frappr can enter their name, zip code and other information. Their locations are then marked on the map with a clickable flag that pops up their information. (Netsquared)
  • WayFaring
    • Create, view, share and and personalize your own custom made map. The user-interface on this tool looks very user-friendly.
  • DataPlace
  • Dabble DB
    • Helps you create online databases to manage, share and explore data and to build web applications. Some that can be represented in the form of a map to help breakdown and identify trends.
  • MapPoint
    • A product of Microsoft, this tool helps you visualize and translate your data into meaningful information.

Apps

Wrap Up

Mapping is a great visual. However, for the map to be both effective and useful, it must be fueled by great content while also being data-driven. Thought this research document is from 2002, skimming through it shows just how data can be re-constructed to be meaningful and cohesive. However, this is where I believe mashups come into play too.

What are your thoughts on mapping technology?

Photo credit: flickr, dannysullivan

Liked what you read? Feel free to share with others: Bookmark and Share